Nifty Realty Index Analysis. As on Saturday 26 Dec 2020. CMP 299
Bottom line : Price is in the latter stages of it's rally. Provided below are both elliott wave and non-elliott counts. The non-elliott count is also quite fascinating.
Price has followed script very well under both elliott and classical technicals. Do look back to the posts from 12 September to see how price has followed projected path almost to a T, and reached 308 on 17 Dec.
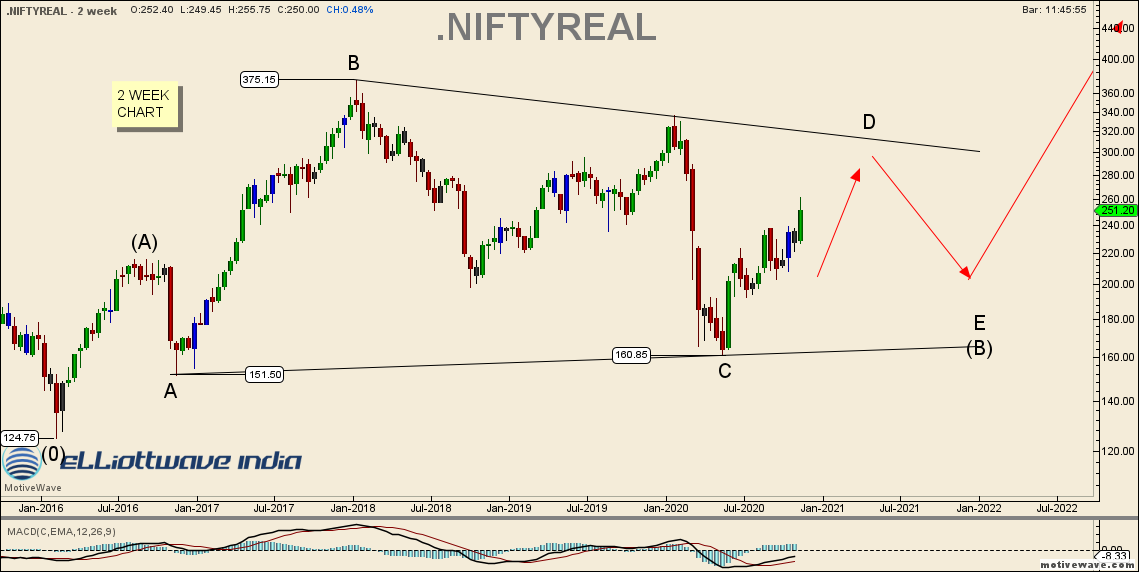
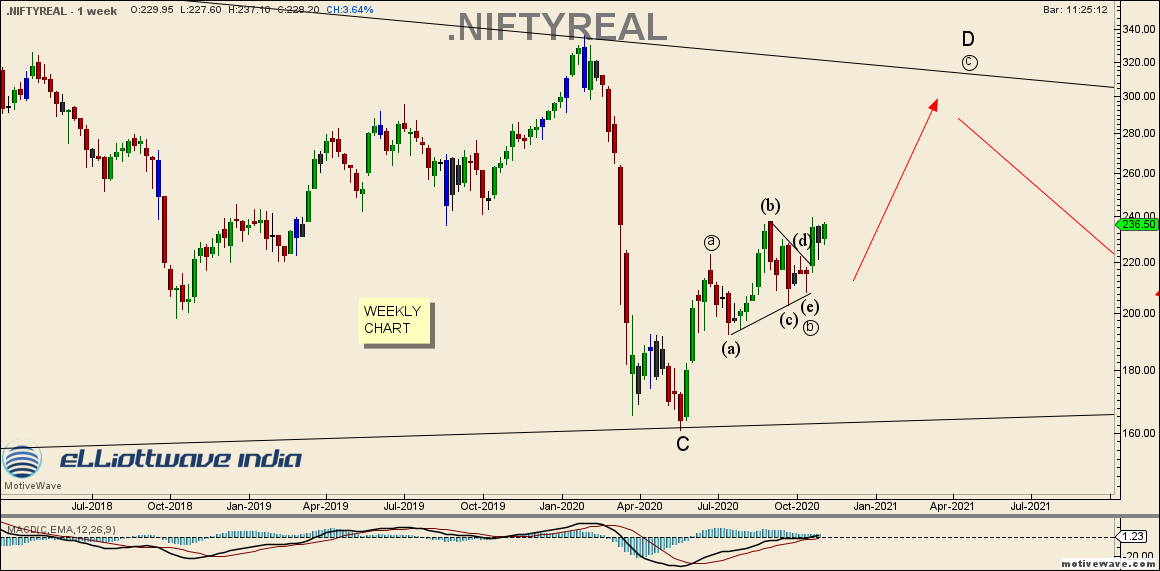
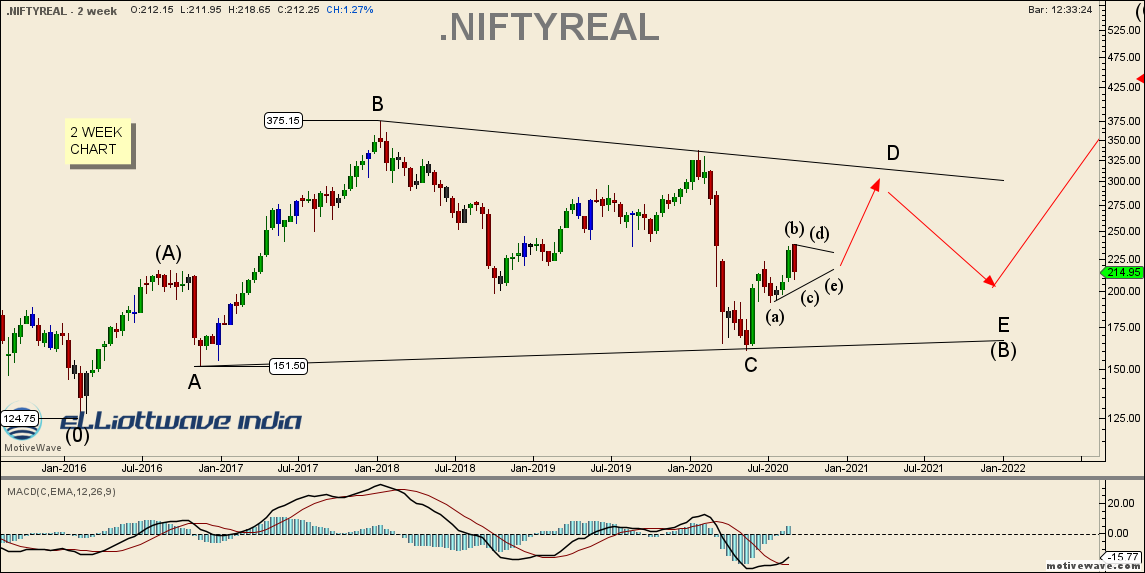
From post of 20 Nov when price wasw 251 : "On the 2 week chart, Hypothesis based on the larger triangle calls for price to reach above 300".
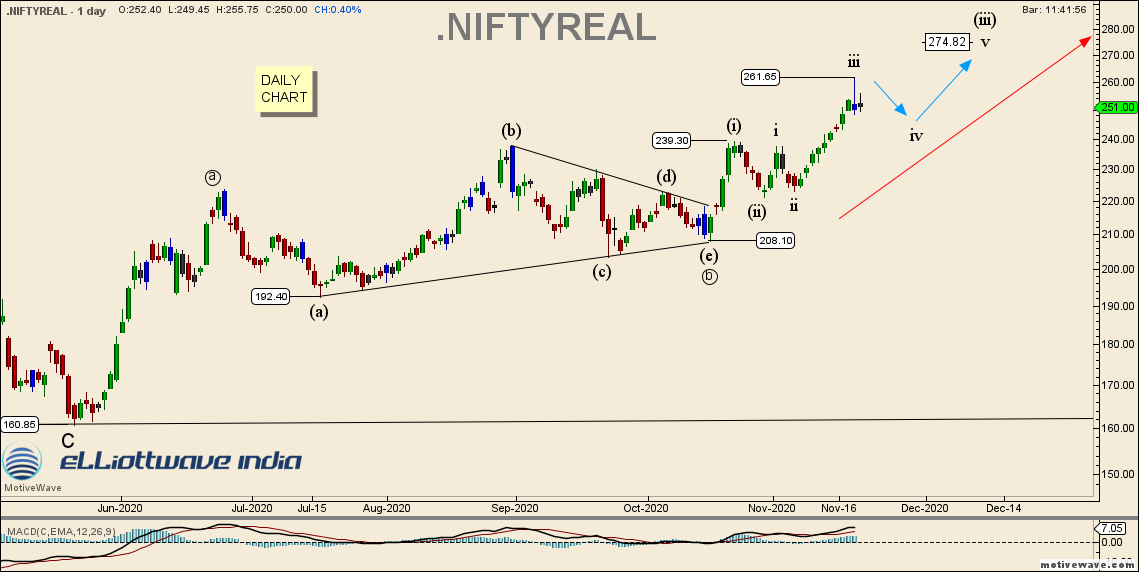
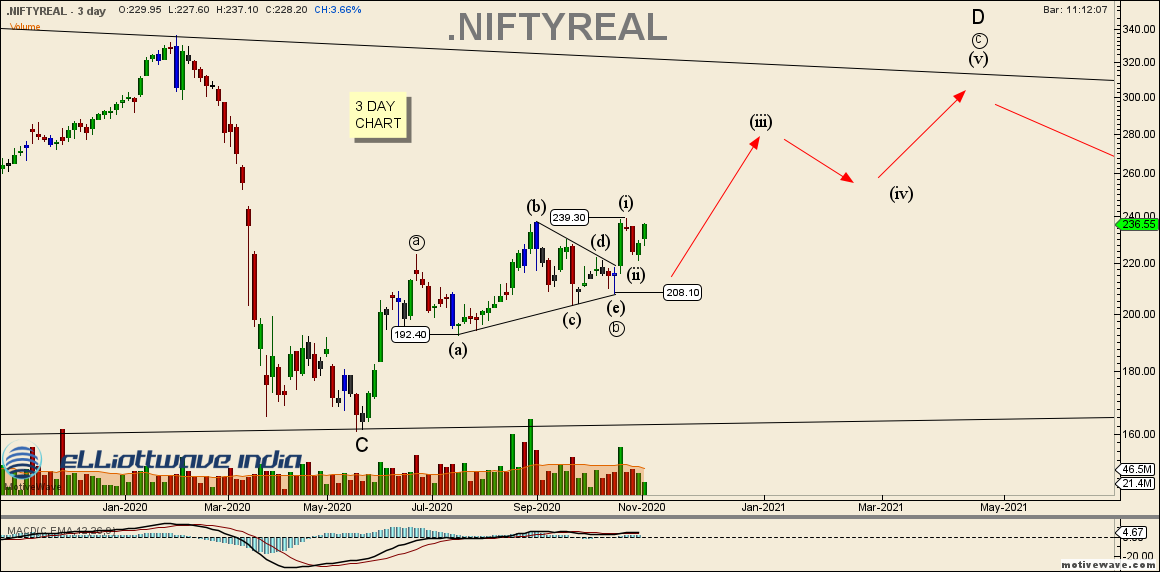
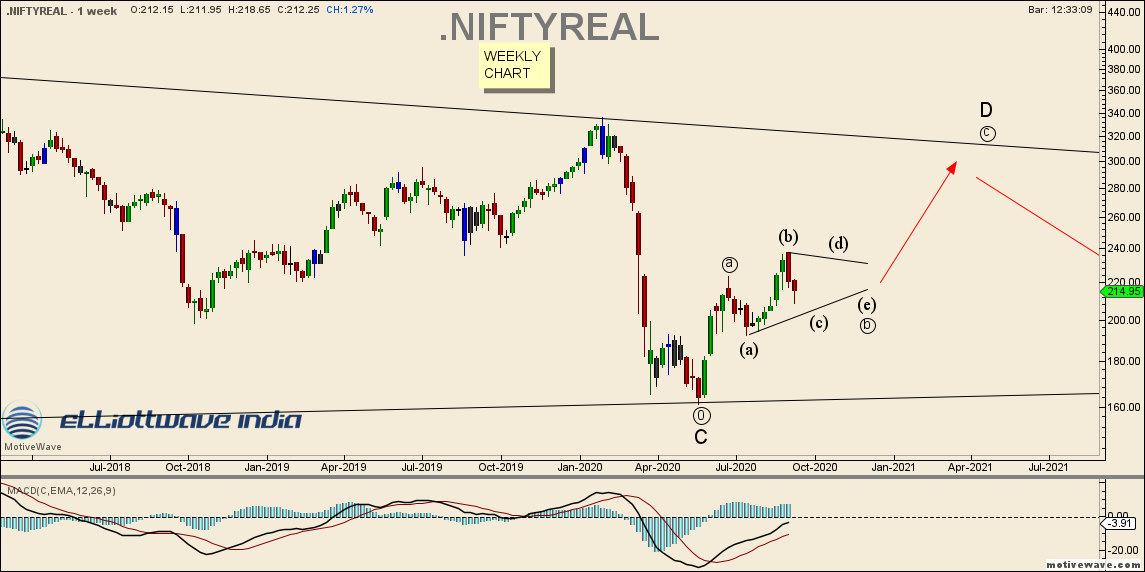
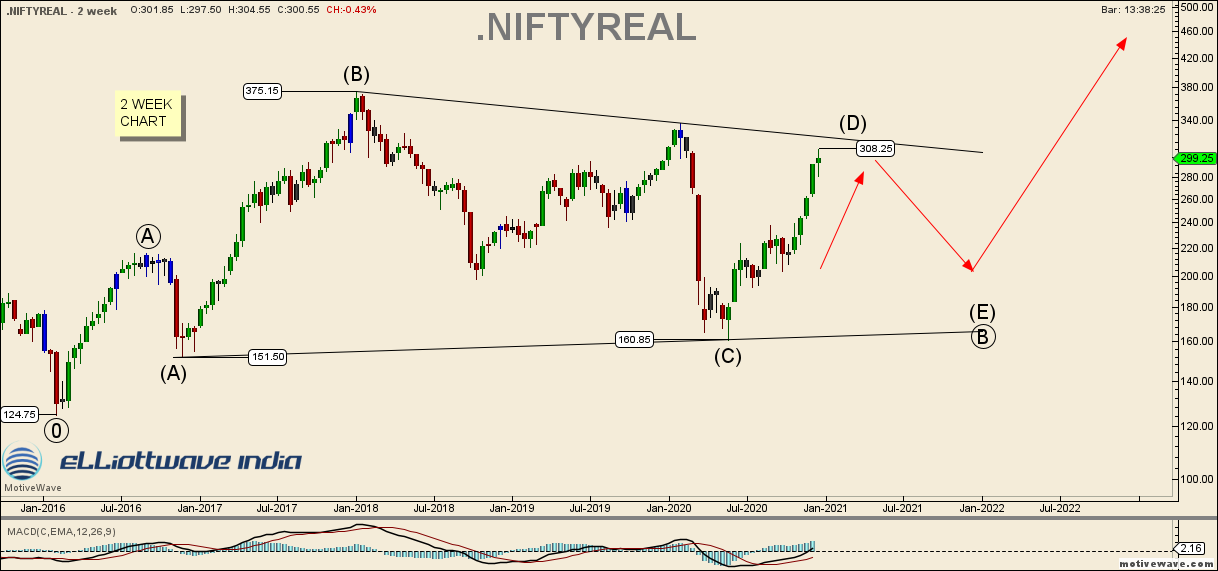
Elliott Wave Count : Index has likely finished a wave iii of minute degree at 308 and is in a wave iv correction currently.
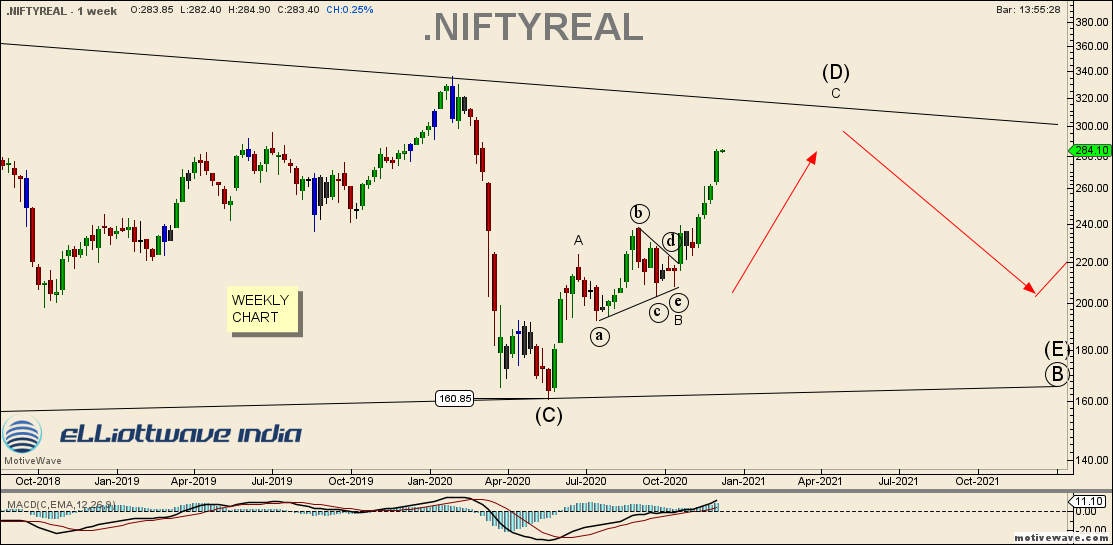
Note that price has already met minimum requirement for wave D of the larger triangle, so caution is warranted.
It is quite possible that price would still reach the 320 ~ 350 level that was outlined as resistance months ago. This would complete wave D of the larger triangle.


--
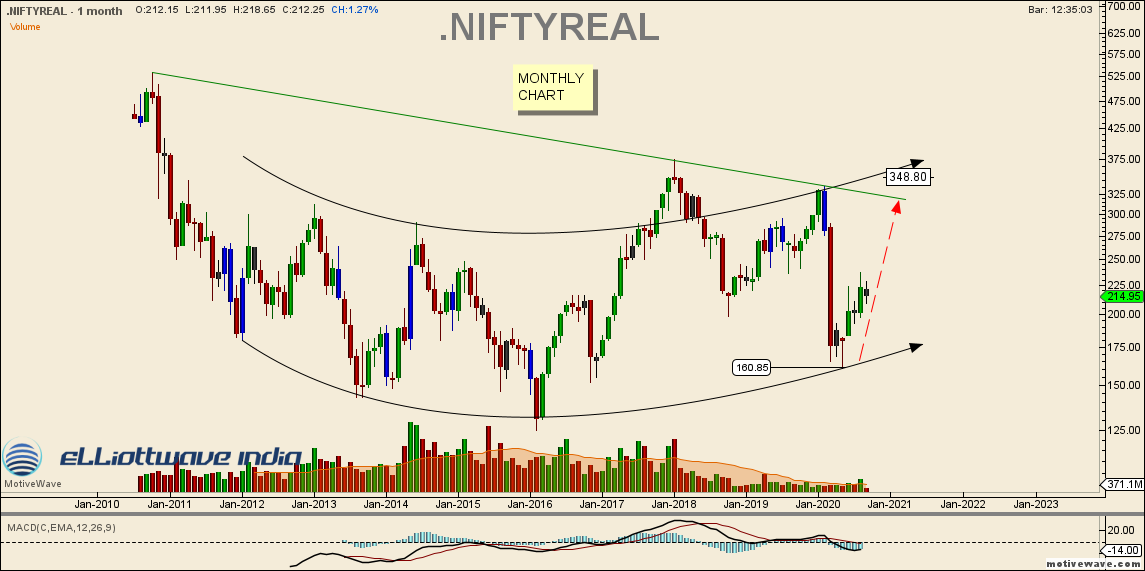
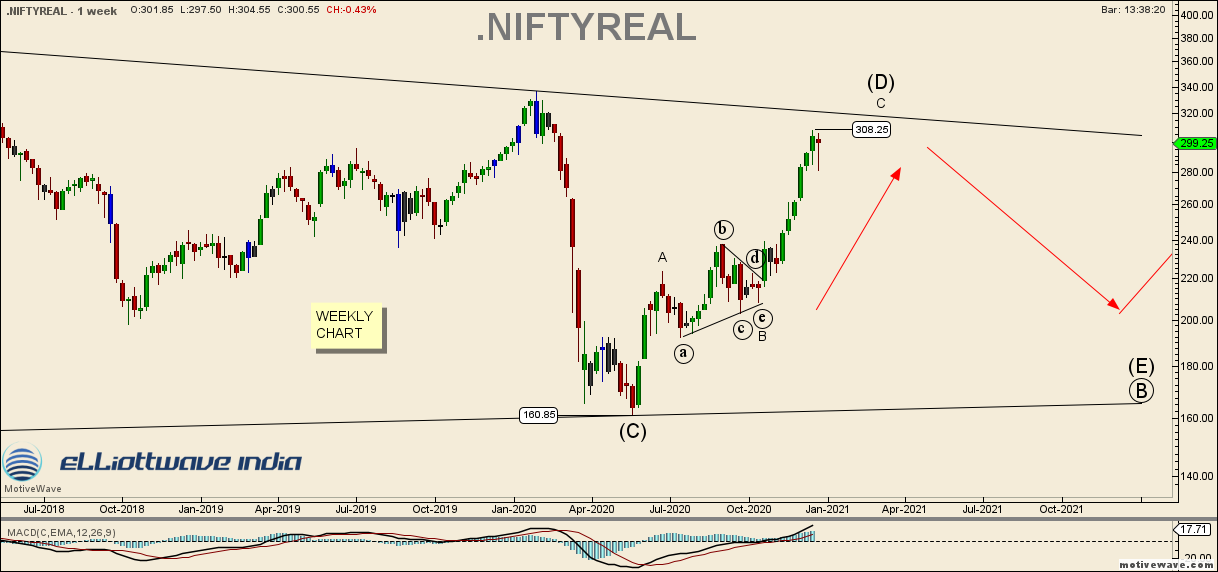
Non-elliott wave chart : Rounded Bottom formation.

It is fascinating to read the post of 12 Sept 2020 when price was at 214. This is what was said then
Quote
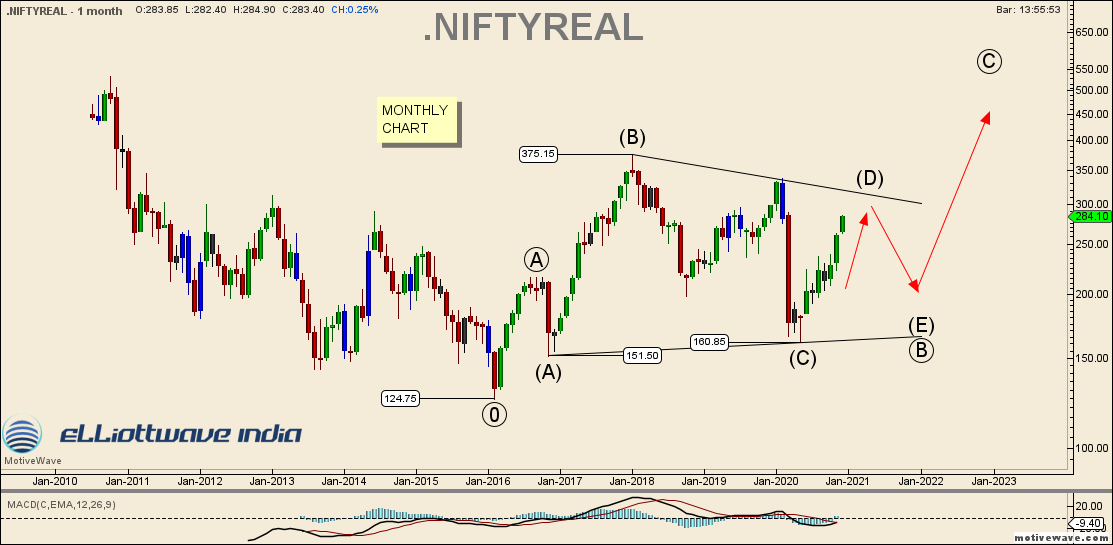
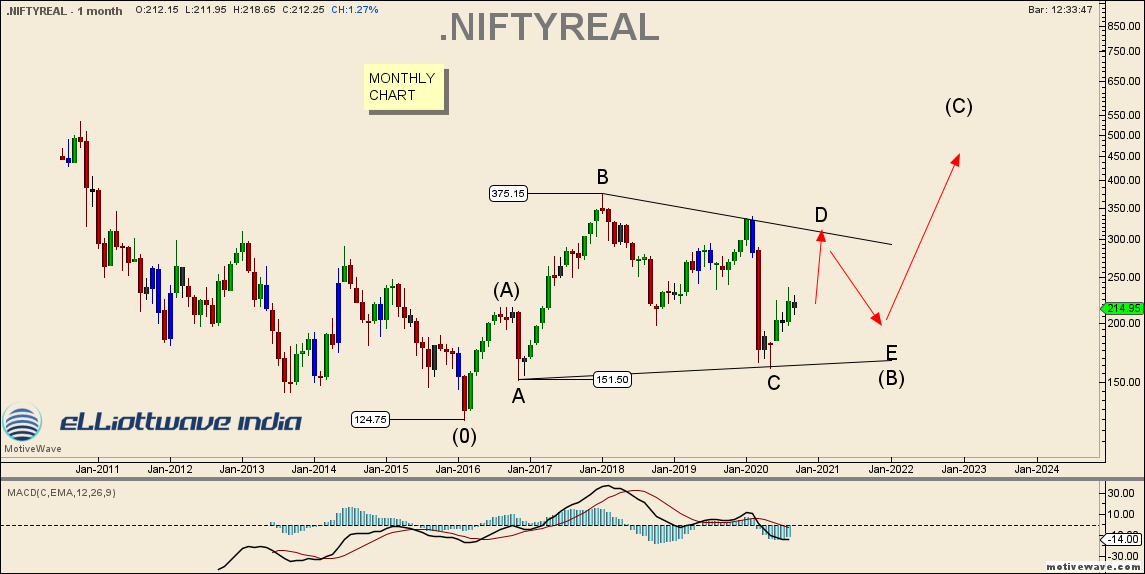
First chart we look at is the monthly chart. It may not help for short term trading purposes, but it could provide a blueprint for the long term.
A rounded bottom appears to have formed / forming. As long as 160 is not violated, price remains sideways to bullish.
Strong resistance comes in at the 320 ~ 350 level, but that is a long way away.
Unquote
Update on 26 Dec : Price has already crossed 300 in 3 months since, and looks likely to test that 320-350 level mentioned over 3 months ago.